Life History & Behaviour
Reproduction
Sponges are capable of reproducing both sexually and asexually (Hill & Hill 2009). Asexual reproduction occurs predominately via fragmentation however budding is known to occur in some sponge species (Ruppert, Fox & Barnes 2004). Reproduction via fragmentation occurs when a wave, current or predator damages the sponge allowing the damage sponge to attach to a new substrate (Ruppert, Fox & Barnes 2004). Once attached to a substrate the cells reorganises itself to form a new sponge (Ruppert, Fox & Barnes 2004).
Sexual reproduction is also common and most sponges are hermaphrodites possessing both sperm and egg cells (Ruppert, Fox & Barnes 2004; Hill & Hill 2009).When sperm cells enter the aquiferous system they are transported to the choanocyte chamber where the choanocyte becomes ameboid (a carrier cell) and transports the sperm nucleus to the egg. Once the carrier cells reaches the egg fertilisation begins (Ruppert, Fox & Barnes 2004).
The development of embryos is diverse across different species of sponge (Ruppert, Fox & Barnes 2004). A common form in Demospongiae is parenchymella larva (Ruppert, Fox & Barnes 2004). Species of sponge in the genus Haliclona develop parenchymella larva that is released from the adult sponge into the plankton where after settlement it then undergoes complex metamorphosis to form a juvenile (Ruppert, Fox & Barnes 2004)
Larvae development in sponges from the genus Haliclona adapted from Ruppert, Fox & Barnes 2004.
Respiration & Gas Exchange
The process of respiration and gas exchange in Porifera occurs via the aquiferous system (Ruppert, Fox & Barnes 2004; Hill & Hill 2009). The aquiferous system ventilates the entire body allowing the diffusion of gases through the cells anywhere in the body. This system of diffusion allows an adequate transportation of gases and metabolic wastes between the body and the water in the aquiferous system (Ruppert, Fox & Barnes 2004).
Feeding
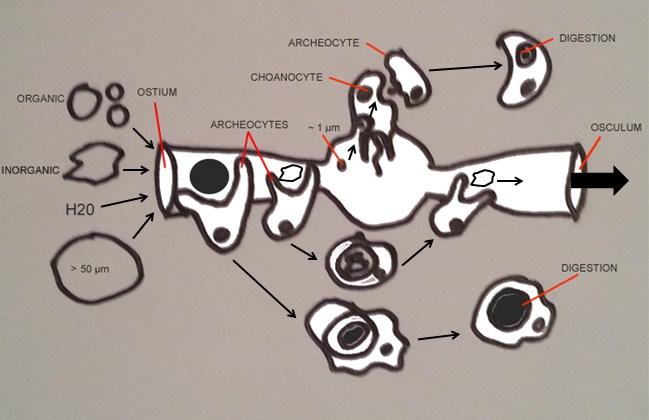
Sponges are efficient filter feeders with the ability to consume 95% or particles in their environment (Hill & Hill 2009). They get their nutrients from the food particles in the water that enters the aquiferous system via the ostia (Ruppert, Fox & Barnes 2004; Loredana et al. 2006). The particles that flow through the body are trapped in different parts of the aquiferous systems. Some particles are engulfed by archeocytes or choanocytes depending on the size of the particle. Large sized particles between 50µm and 5µm are taken by archeocytes while particles smaller than 5µm enter the choanocyte chamber where choanocytes engulf them. While both cells trap different particle sizes the choanocytes often transfer the smaller particles to archeocytes for digestion. Inorganic particles that are not digested by the sponge are removed from the aquiferous system via the oculum. Common particles that are digested by sponges in the genus demospongiae include; heterotrophic bacteria and eukaryotes, phytoplankton, detritus and other organic material with picoplankton being the most common at a size of <2µm (Loredana et al. 2006).The size range of organic particles that demospongiae can filter are between 0.1µm-50µm (Ruppert, Fox & Barnes 2004; Stabili
et al. 2006).
On Heron Island Haliclona spp. sponges were placed into environments with three different organic particle sizes to see if the size the food effected the consumption of algae. It was hypothesised that the larger sized particles (7µm-20µm) would not be consumed as much compared to the smaller sized particles (1µm-2µm and 4µm-7µm). The sponges were located at Shark Bay, Heron Island on the underside of boulders. Three treatments were set up for the three different sized algae. Each treatment contained 100mL of water and an algae dry weight of 0.03%/volume.
Treatment 1 (1-2µm): 166.5µm of Nannochloropsis sp. was added to 100ml of water
Treatment 2 (4-7µm): 375µm of Pavlovasp. was added to 100mL of water
Treatment 3 (7-20µm): 0.5mL of TW sp. was added to 100mL of water
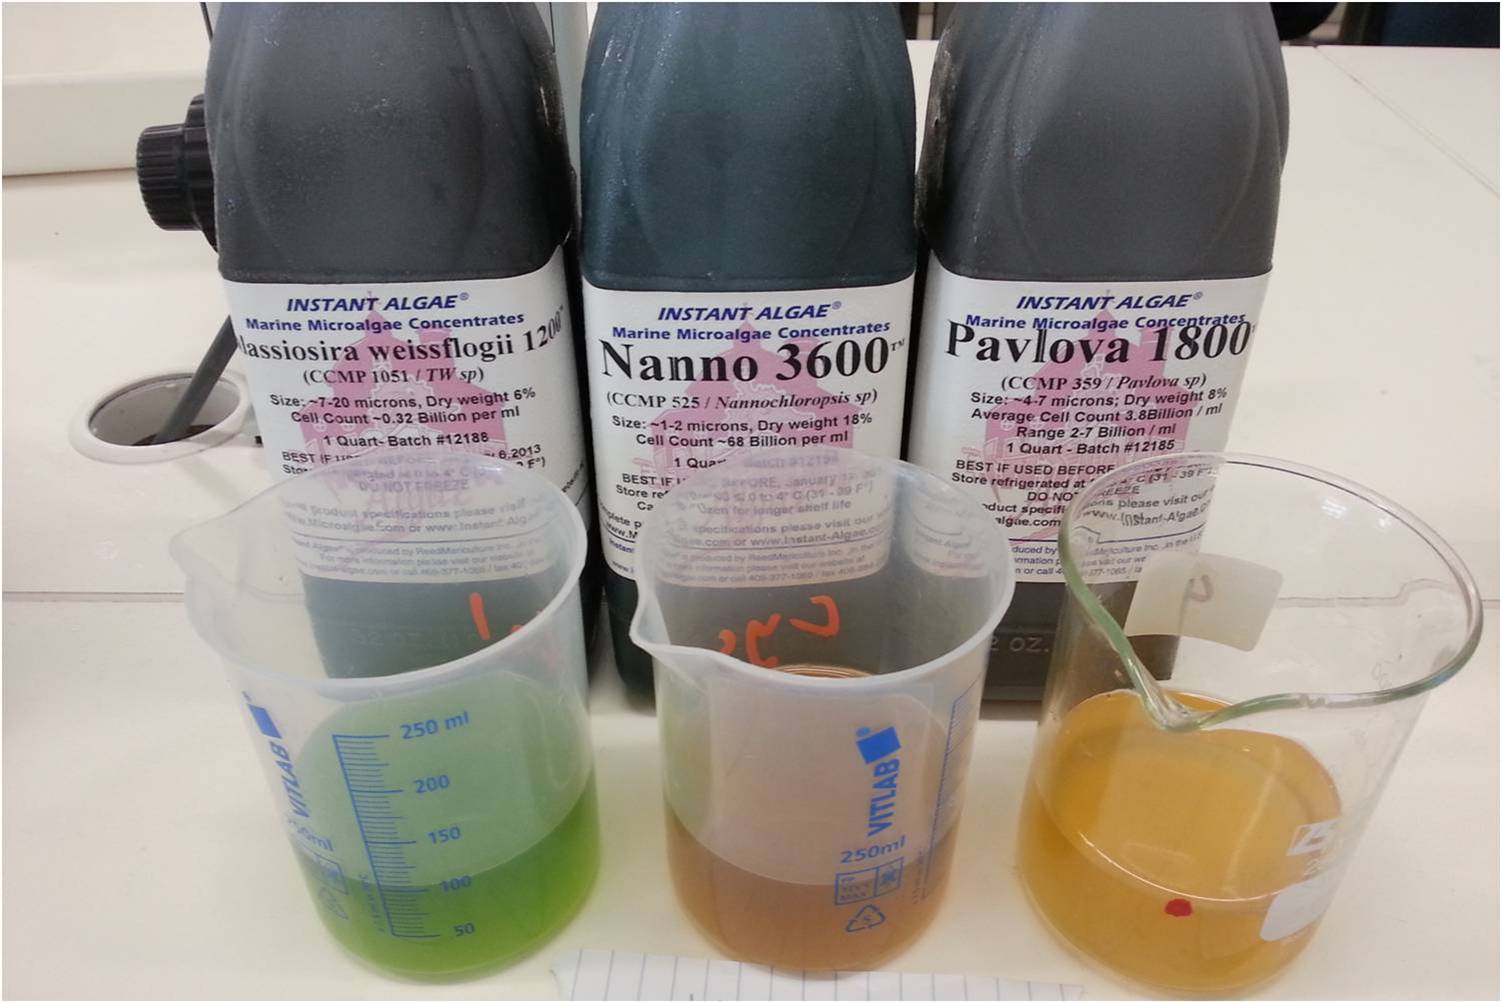
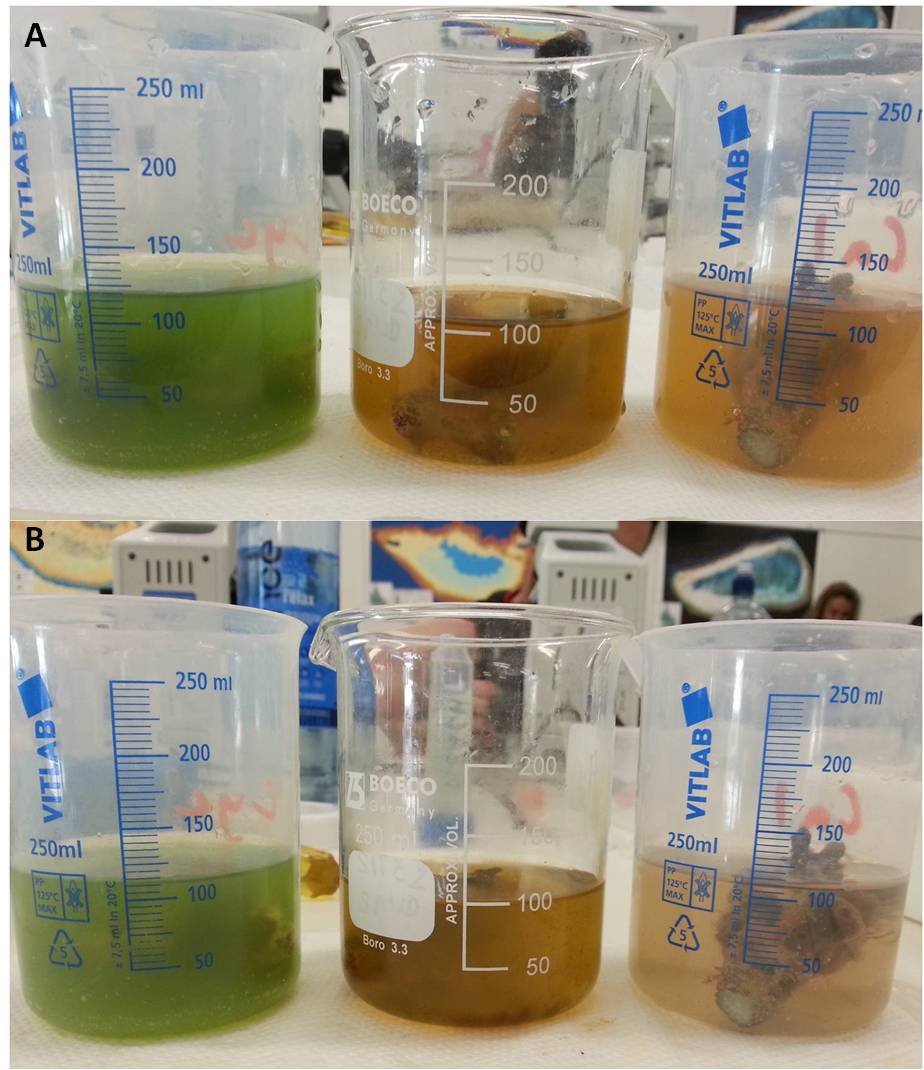
The three treatments with 1-2µm on the left, 4-7µm
in the middle and 7-20µm on the right.
The sponges were placed into the water and algae solution and every 20mins starting at time 0 over two hours 100mL of the solution was taken for chlorophyll absorption analysis. Seven samples of each treatment were taken leaving a total of 21 samples. Due to lack of time only two replicates were conducted.
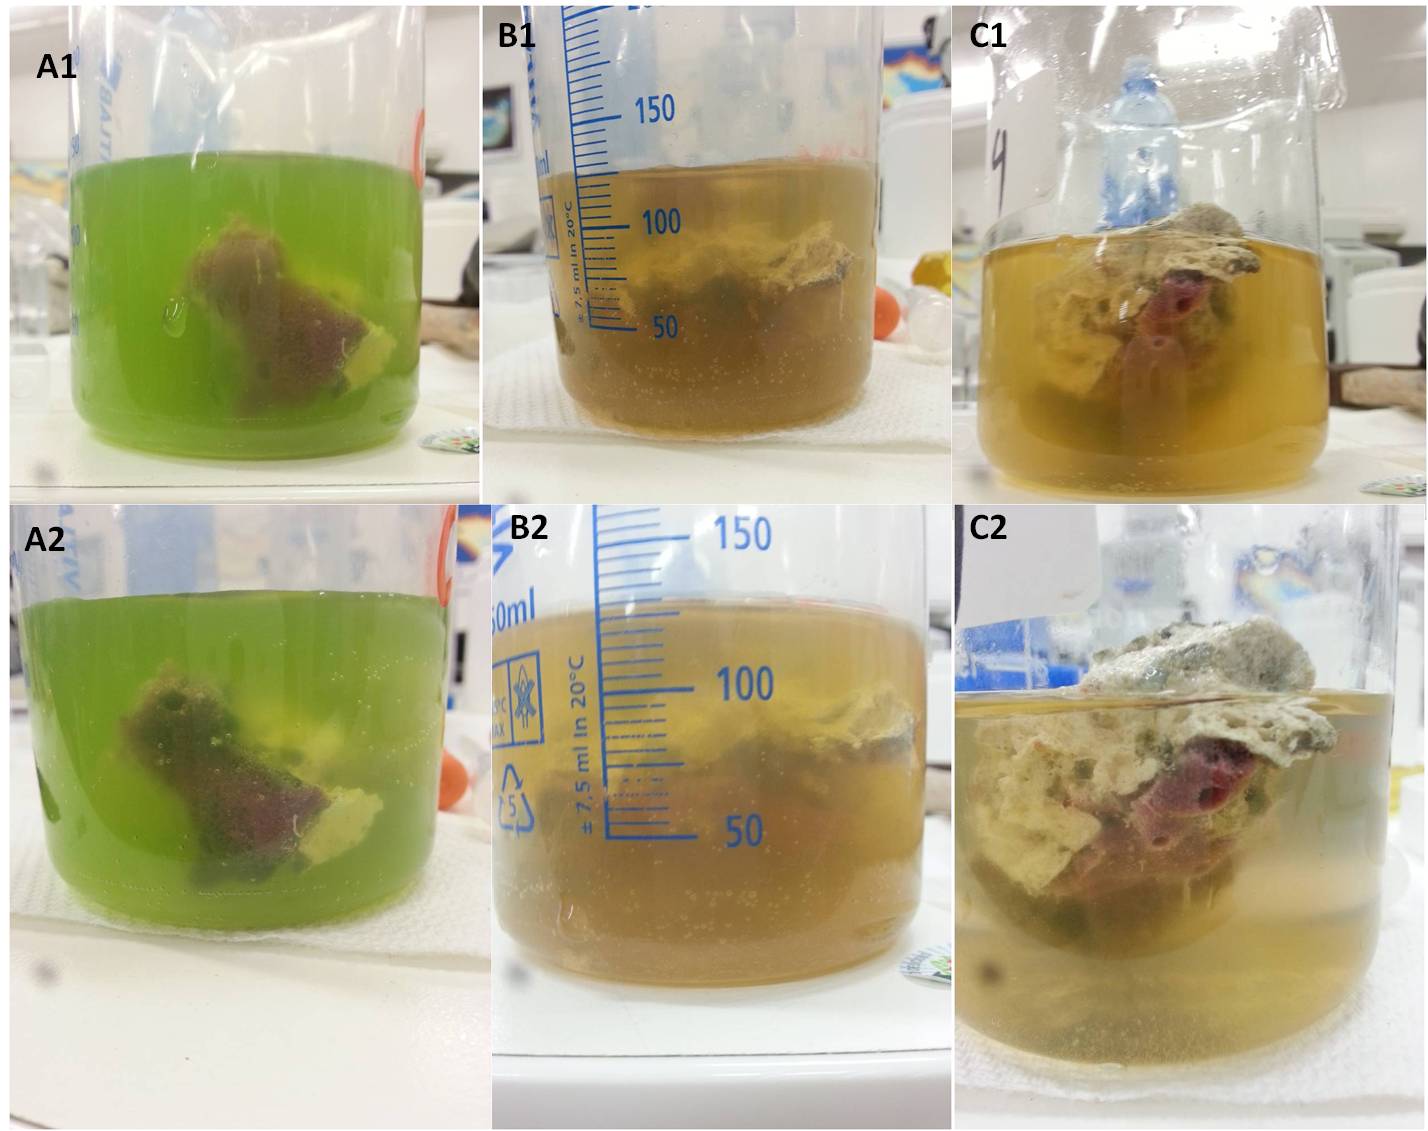 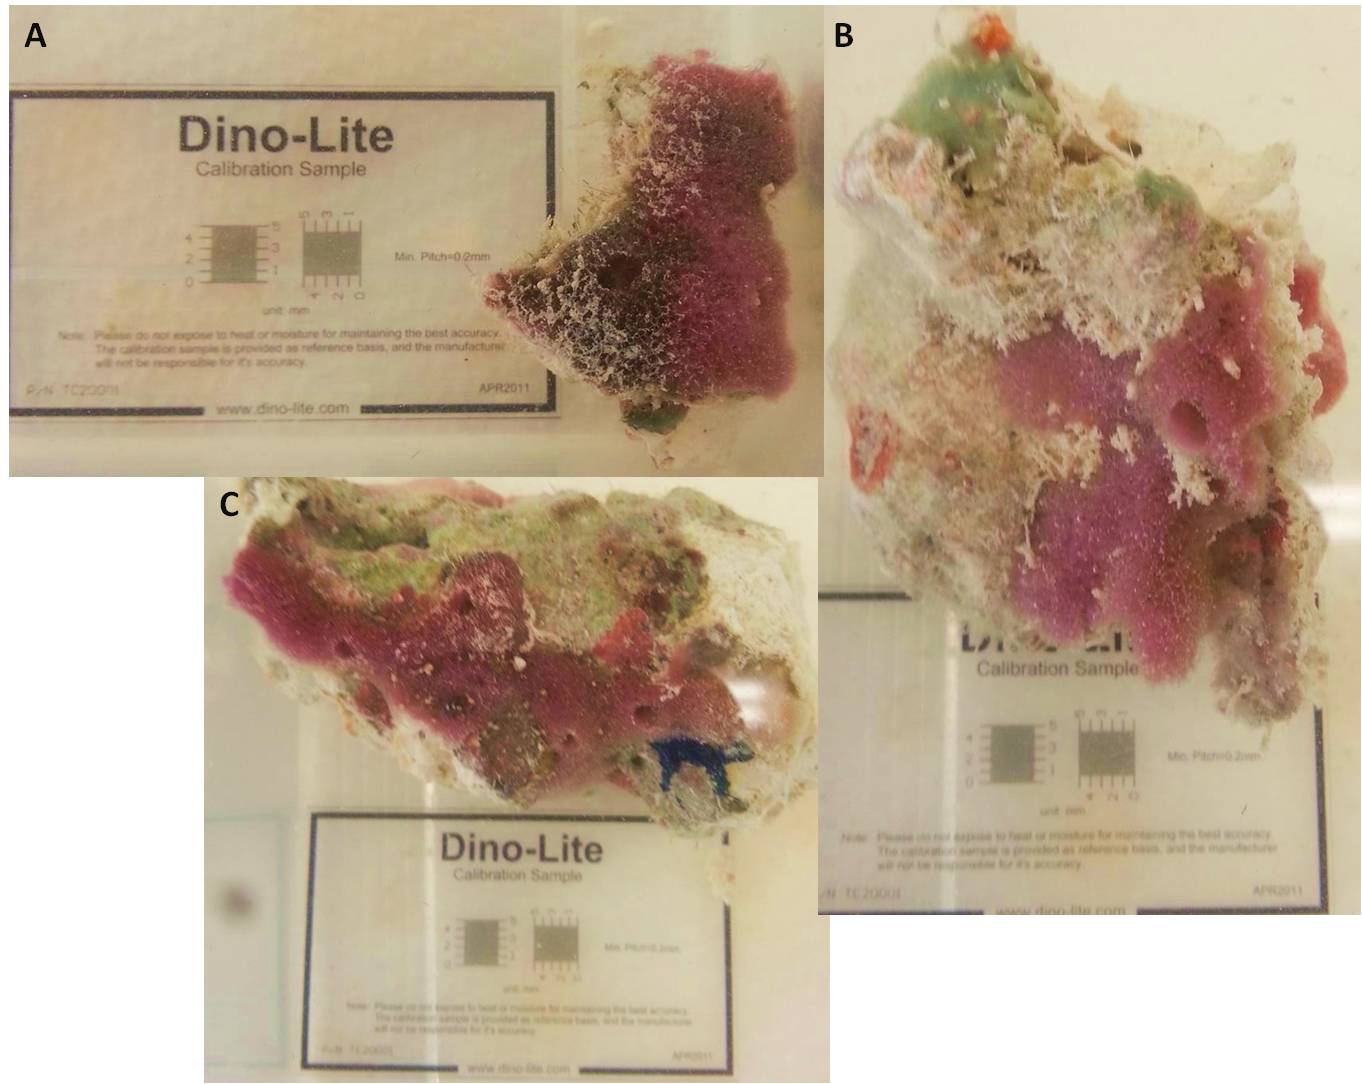
Before and after pictures taken of the first trial; Pictures of the sponges used for trial one A) was in
A1) 1-2µm at time 0, A2) 1-2µm at 2 hours, 1-2µm B) 4-7µm and C) 7-20µm.
B1) 4-7µm at time 0, B2) 4-7µm at 2 hours,
C1) 7-20µm at time 0, C2) 7-20µm at 2 hours.
 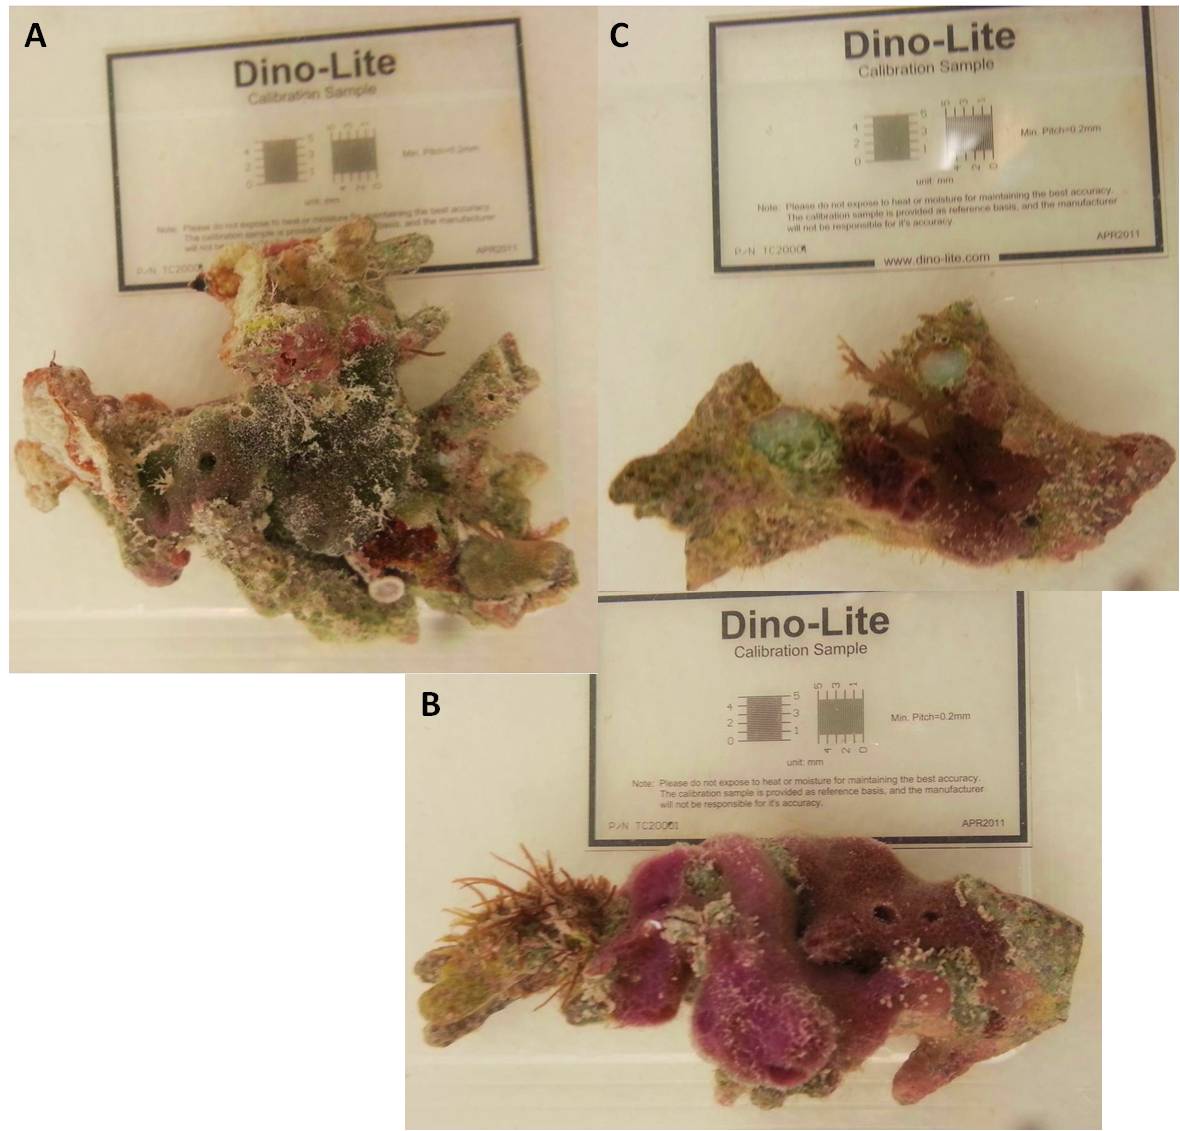
Before and after pictures taken of the second trial; Pictures of the sponges used for trial two A) was in
A1) 1-2µm at time 0, A2) 1-2µm at 2 hours, 1-2µm B) 4-7µm and C) 7-20µm.
B1) 4-7µm at time 0, B2) 4-7µm at 2 hours,
C1) 7-20µm at time 0, C2) 7-20µm at 2 hours.
From the absorption data the dry weight % of the algae was calculated by using a standard curve of absorption against dry weight % of algae. Once the dry weight % of algae was calculated the difference between time 0 and time 120 was taken and an ANOVA and a pairwise t-test was conducted for statistical analysis. The original data was transformed to natural log for both calculating the dry weight % and for the statistical analysis.
A) B)
Figure 1: The percentage of dry weight lost after 20 minutes within two hours for three treatments; 1-2µm, 4-7µm and 7-20µm. A) are the results from the first trial and B) are the results from the second trial.
When comparing the dry weight % of algae from time 0 to time 120 a decrease in dry weight % is displayed (Figure 1). However when observing the trend of dry weight % across the 120mins it shows an increase in dry weight % with the second replicate at 4µm-7µm particle size increasing above the starting dry weight %by 8.7% (Figure 1B). The ANOVA statistical analysis compared all three treatments and displayed a significant difference (p= ≤0.5). This result informs us that there is a significant difference within the dry weight % values however it does not provide information on where exactly the significant difference is occurring. A pairwise t.test was then conducted to see where the significant difference was occurring. The results displayed a significant (p= ≤0.05) difference between medium and large algae size and medium and small algae size. The small and large particle size did not display any significance. The results from this short experiment reject the hypothesis and demonstrated that Haliclona spp. consumed more algae when the particles were between 4-7µm.
Authors Side Note: An interesting observation was made during the pilot study of this experiment. The sponge absorbed all of the algae in the 100mL of water in less than 2 hours and as a result the pink-purple sponge turned green. Within approximately 12 hours the sponge turned brown and at approximately 24 hours since the pilot experiment the sponge had transformed back to its original pink-purple colour.
|